
One equation to rule all startups (and other stuff too)
The propagation of a product, an idea, or a disease, follows a well-defined trend. For startuppers, understanding it gives an edge when working to maximize growth.
This article has been written in collaboration with Dimitri Bozovic, who has written extensively about Spotify’s and Snapchat’s valuations. He also happens to be my brother.
Check out the four charts below. Not looking at the axes, the curves are eerily similar, aren’t they? What are they?
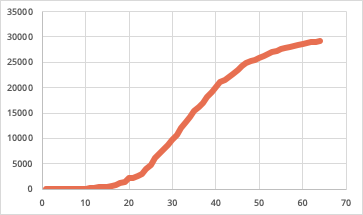
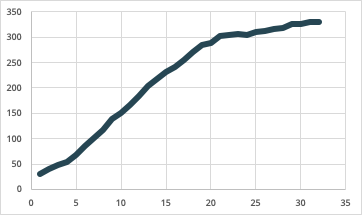
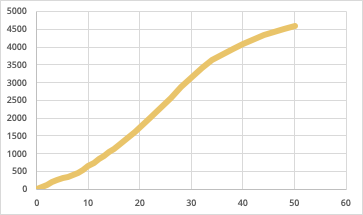
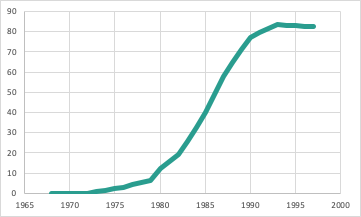
You just saw, from left to right:
the number of coronavirus cases in Switzerland since the first infection
the number of monthly active users of Twitter from 2010 to 2018
the number of views of Despacito in the year after the video’s release
the proportion of US households owning a microwave from the 1960s to the 1990s
Let’s stack them, normalized, just to see how similar they are:

They coincide so much in fact that we had to make the lines half-transparent, lest some of them be hardly visible.
Note that we don’t claim these datasets are correlated. They are not: these are widely different time periods. However we do claim that they follow the same trend, and this is true for almost any propagation of a disease or idea in a population. We didn’t have to mine any data to find matching curves: we took the first four datasets that came to our minds.
These curves look similar because they all follow the same mathematical function: the logistic function, or S curve.
Understanding it helps understand (and project!) how a disease or a fad will evolve, or—which is of bigger interest here—how a startup will grow. When will the hype stop? What market penetration will it have? How can you maximize it? These are all questions the S curve can help answer, and that surprisingly few people look at when talking about growth or company valuation.
The S curve
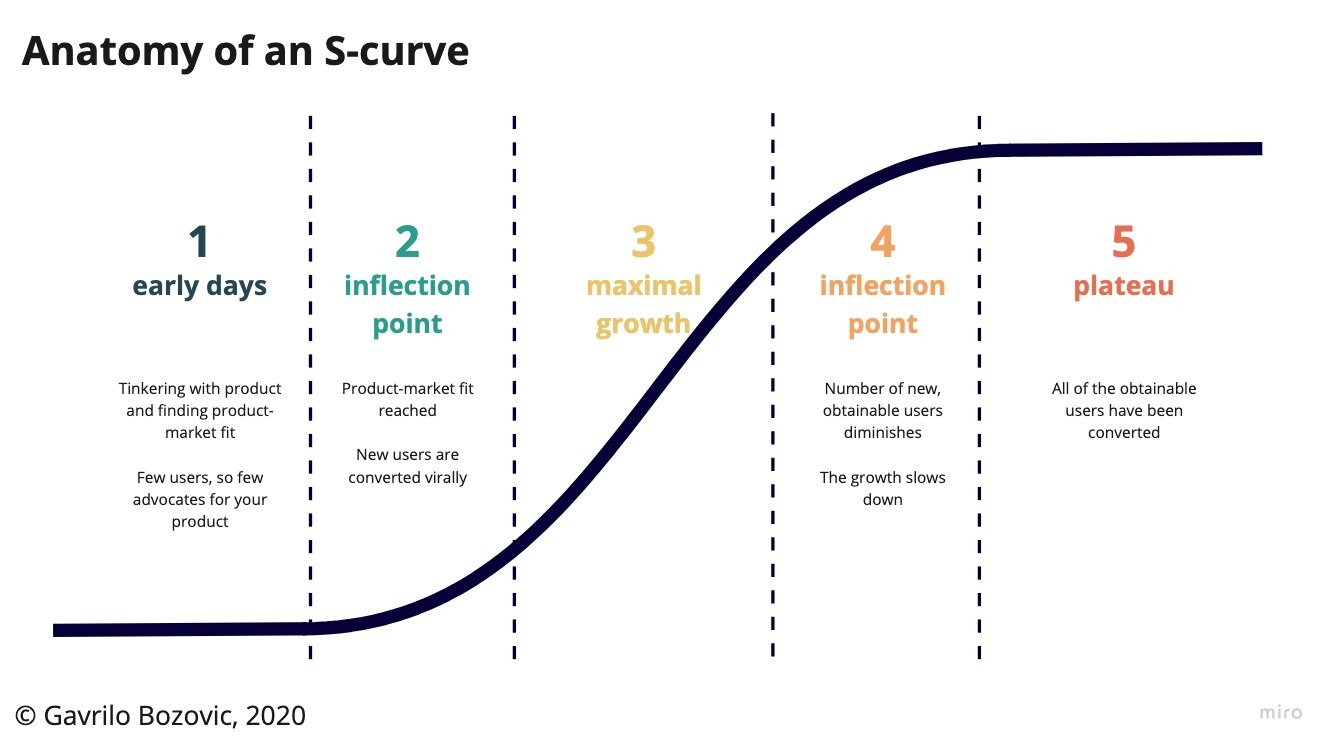
The logistic function takes its colloquial name from its characteristic S shape. It follows 5 stages:
The first phase has low numbers, and low growth
It is followed by an inflection point where the growth starts accelerating
The growth reaches a maximum rate and the curve looks linear for a while
At some point another inflection point is reached where the growth slows down
The curve steadies at a plateau
People infected by a disease, users of a product, views of a video: all of these will evolve following the same pattern. Why? Let’s break the curve down with the example of an imaginary company. Let’s imagine some ambitious founders spotted an emerging medical procedure and decided to capitalize on it by founding IVBleach: the premier provider of intravenous bleach as-a-service to treat various infections.
For IVBleach, the early days are when the company is looking for its product-market fit. They are tinkering with the concept and doing the first sales door-to-door. Few people know the product and therefore few people are there to talk about it and show it off in the streets. The growth is very slow. At a certain point, though, the company reaches product-market fit (i.e. it stops killing its users, in this case) and sees its growth accelerate: each new customer influences further prospects, some of whom convert. This is the first inflection point. The growth increases until it reaches a period of maximal growth. However, as the number of users of intravenous bleach increases, fewer and fewer prospects remain to be converted. This leads the company to reach another inflection point down the road, after which the number of users steadies at a plateau.
So this is all about virality, right?
Well, yes and no. Yes in the sense that a virus, as an idea, spreads through a population following a logistic function. However, while in the case of a disease a new host is contaminated as soon as they are exposed, for ideas it is not that simple.
Let’s make a thought experiment: let’s assume IVBleach could launch with the mother of all media campaigns. Their service would be promoted through every conceivable channel, so that everyone, without any exception, would be aware of it since the very first day. What would happen? Would it reach its plateau on day 1?
No. The simple reason behind it is the technology adoption life cycle. As the paper that introduced the concept states:
“Some people adopt ideas when they are first introduced; others wait a long time; while some never adopt an idea.”
The technology adoption life cycle goes on to divide people among 5 categories, from the innovators to the laggards. The innovators are the ones who enjoy technology for its own sake, who will try something out just to see if it works. The laggards are at the other extreme, waiting for technologies to become extremely mature before coming on board. The distribution among the population is expected to be that of a bell curve, as are many other human qualities. (The descriptions of the categories are lifted from Geoffrey A. Moore’s exceptional book Crossing the Chasm.)

So when IVBleach comes in the market, even if everyone is instantly made aware of the service, not everyone will come on board. The first ones will be the innovators: they will be curious to try it out, regardless of whether their peers are using it or whether the product is mature.
Early adopters will hop on board after the innovators, and will do much of the work to bring the product to the mainstream. The majority will require seeing lots of their peers using a certain product before adopting it, and will come later. At the end will be laggards, who dislike disruptive innovation and will come, dragging their feet, once the product is already deeply established.
As IVBleach goes through these classes of customers, they will be added to its total number of customers. First only few innovators will be added. Then, larger numbers of early adopters, then an even larger majority, before adding smaller and smaller numbers of laggards. You guessed it: that draws a logistic function.

By the way, this is exactly what is happening in the creation of the dancing crowd often talked about at Sasquatch music festival 2009, when a single guy started a whole dance party. He danced alone for a long time, then another person joined in, then a few more, and suddenly you have a crowd, with laggards being dragged in at the end.
Why the S curve matters
The coronavirus, a song, a service or product all “infect” a certain population at a rate modeled by an S curve. The great thing about the logistic function is that it is very simple, with only two parameters:
The carrying capacity: how many people will be reached in the end
The growth rate: how fast new users are converted
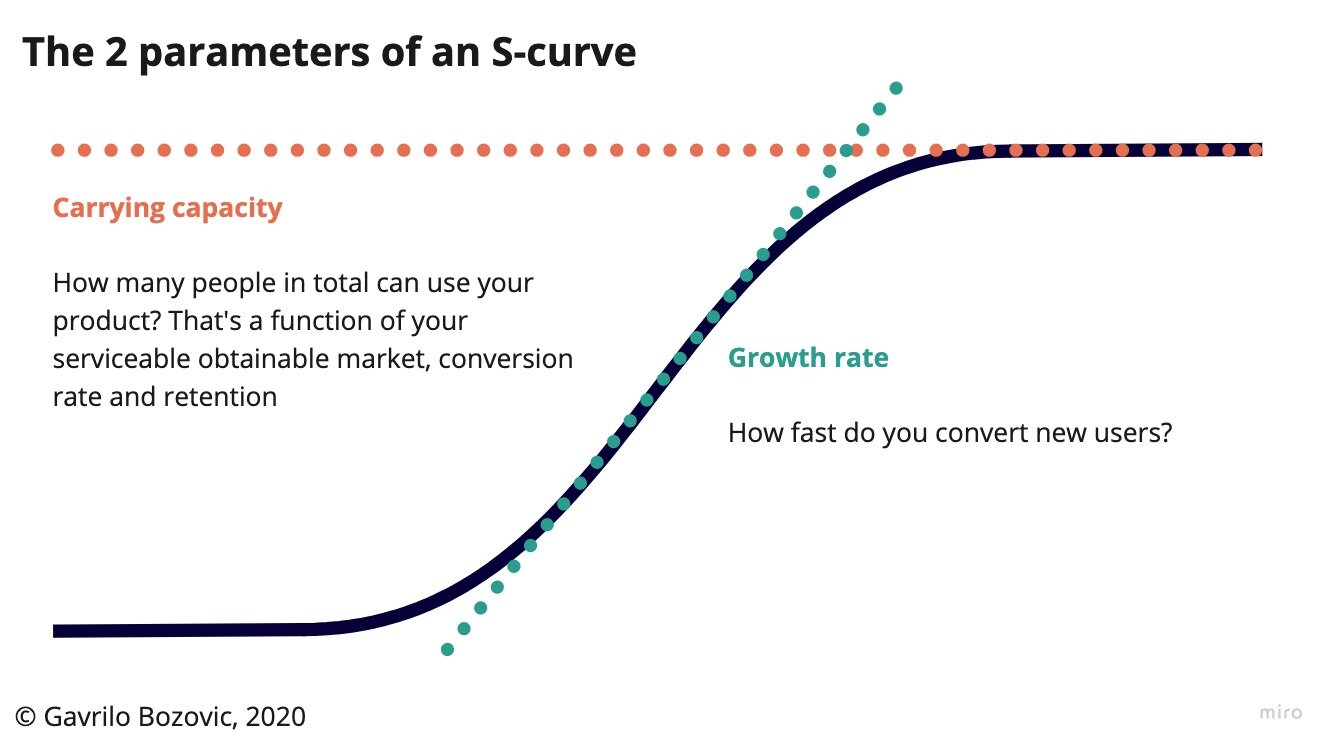
This makes the function easy to fit on actual data, but it also shows the two major levers for growth of a company.
To grow IVBleach’s profits, its founders will have to either increase their growth rate, to realize profits as early as possible, or to increase their carrying capacity, to reach more people. Ideally, they would like to do both.
Increasing the carrying capacity means increasing the serviceable obtainable market, which means reaching more people. IVBleach can do that by translating its website in other languages, opening more stores, or making new product lines. For a company that is reaching an extremely high plateau, increasing carrying capacity can mean radical ideas such as bringing Internet by balloon or satellite to as-yet-non-connected people, in the case of Google and Facebook, respectively.
Increasing the growth rate goes through virality and advertising/marketing. Virality aims at having users promote your product for you, one of the most famous early examples of which was Hotmail adding “Sent from Hotmail. Get your free email here.” to the end of emails. Each email sent from Hotmail was thus turned into a free ad for the company. Marketing and advertising are just different (and paid) methods to get more eyeballs on your product.


In practice: predicting the growth of Facebook and Twitter
Once it is understood that the evolution of the numbers of users of a certain company is likely to follow an S curve, it can be used as a predictive tool: fitting a logistic function on historic data will predict how the usage will evolve through time, what levels it will reach, and when.
In late 2011, we did this exercise for two young but fast-growing companies: Facebook and Twitter. The data we had and our projections are below.
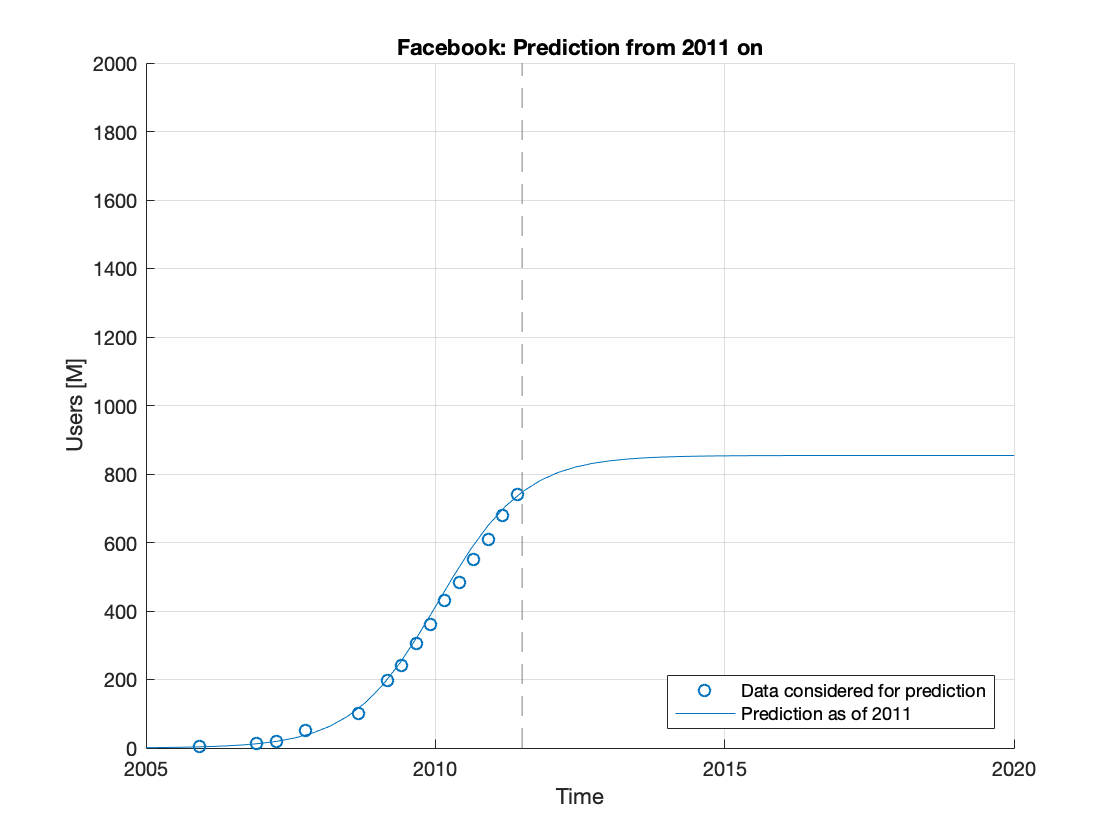
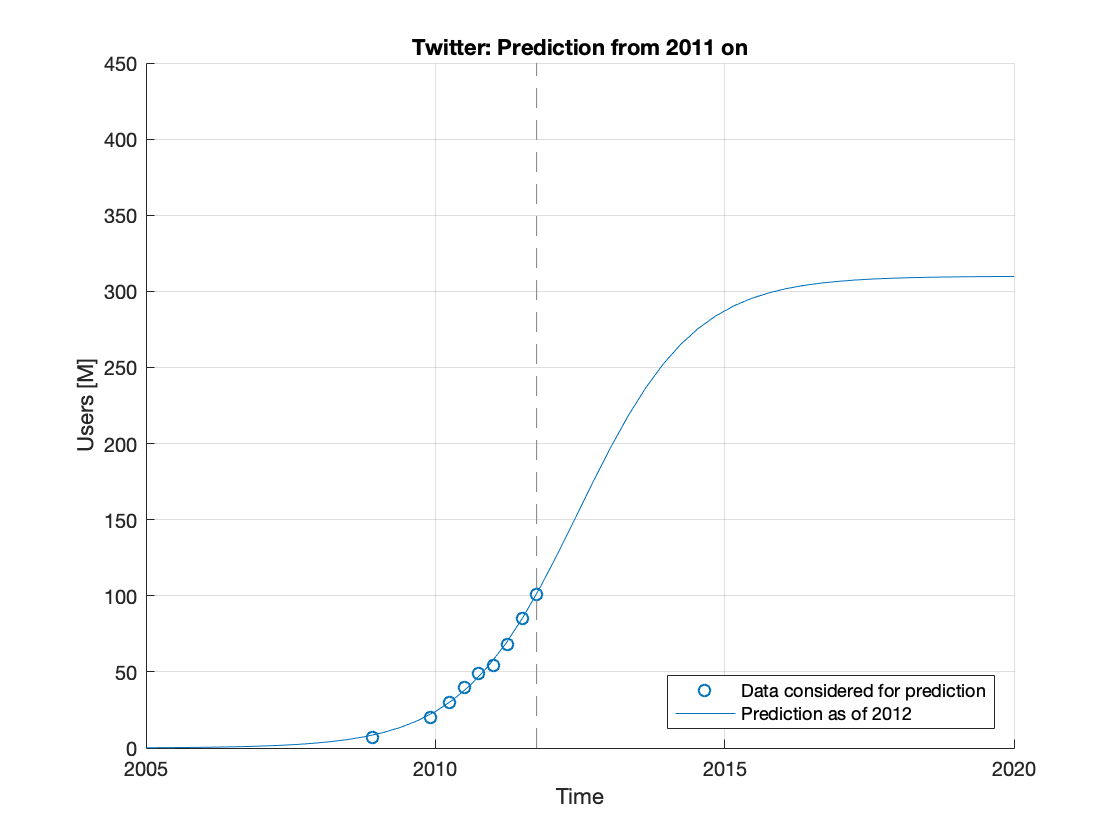
We predicted Twitter would plateau at a little above 300 million monthly active users, by 2017. For Facebook, we estimated that a much higher plateau of 850 million users would be reached around 2013. So how did we do? Here’s the data for Twitter:

As you can see, our prediction is right on the money. Twitter did go to slightly overshoot our estimation, but we were within 10% of the final number, 7 years in advance. I’d call that not bad.
What about Facebook then? Well, have a look by yourself:

At the moment we did the estimation, we thought we were about to reach the second inflection point, and reach a plateau in less than a year. Instead of that, Facebook’s evolution blew us - and many others - away. Facebook has been growing almost linearly all the way up to 2020.
Does that mean the method we used is wrong? No! It is just a testament to the amazing work done by the Facebook growth team, that the Twitter people ought to emulate. Facebook was on track to reach 850 million users less than ten years after its incorporation, which would have been a tremendous success by any standard. Instead, they kept on expanding, adding new markets and users in a seemingly never-ending growth cycle, and now hitting the limit of the number of people on Internet.
There are many explanations about what Facebook did to achieve that, but in our opinion it hinges on 2 main successes. First of all, Facebook was able to get untapped countries and demographics (hello grandma!) to join, thus continuously increasing its carrying capacity. Second (and related to the first), Facebook became such a must-have service that its user curve became strongly correlated with the growth of internet users—meaning that connecting to the internet, for many people, means connecting to Facebook. The increased connectivity in rural places and the explosion of smartphones thus directly drove Facebook’s increasing user numbers.
On the other hand, Twitter freewheeled along the path that their product was always going to take. Oh and by the way, you may wonder why our Twitter data stops in 2019. Are we trying to hide points that don’t match our prediction? Well, no. Twitter stopped reporting monthly active users at that point, replacing that indicator by “monetizable daily active usage”. That new and ill-defined indicator is still growing, but that doesn’t seem to fool the stock market.
S curves and valuation
Another field where understanding of the S curve is helpful is finance, and in particular valuation. The value of a company is the sum of all of the profits and losses it will do in the future, discounted to the present day. I explain that in more detail in this article. This exercise is notoriously difficult to do for startups, since so much of their future is uncertain. It is in fact so difficult that some people have come to belittle the method as useless. It is not: whatever the uncertainty, this is what value is. And regardless of the company’s stage, a discounted cashflow valuation will shed light on the likelihood of the company reaching a certain level, and the critical parameters to get there.
Understanding that your customer base is likely to follow an S curve can help have a more educated discussion around valuation: the S curve can be fitted on your past customer data, to project what number of customers you are likely to reach, and when. This, along with your unit economics, will give you a valuation. Should this method yield unsatisfactory numbers, you will know what levers you will have to use to increase them: increase your carrying capacity and/or growth rate. You will then be able to use the same method to calculate an updated valuation in a scenario where you expand to a different market, advertise your product more aggressively, and so on.
This requires some reliable past data, so is only applicable to companies who have reached product-market fit, but it is still vastly superior to not calculating value at all, or basing it on naive projections of never-ending hockey stick growth.
As the previous example shows, this relatively simple method, applied to publicly available data, allowed predicting with remarkable accuracy the fate of Twitter. And the same projection must have been used as the benchmark to be beaten by the Facebook growth team. And as a result, the Twitter stock price has remained stagnant since the company’s IPO, which is expected since all of the information required to project Twitter’s growth was available at the time. Facebook kept beating expectations, and as a result saw its stock rise by some 1325%.

Wrapping up
A disease, a product or a fad spreading through a population will follow the same trend: an S curve. Understanding it is of particular importance for startups, to have a more sophisticated discussion on the future of a company, to better understand its value, and to have a better rationale for the prioritization of initiatives to increase its growth.
Use it to reflect on your past numbers and understand what they indicate about your future!